Chapter 14 Marking the Way: Line Markers
This chapter examines line markers, symbols that can be used to accent the points of a custom shape.
Markers can be added to the start and end of every segment in a path (or line, polyline, or polygon), or only to the very beginning or end.
Markers have some similarity to line joins and line caps (which we discussed in Chapter 13). Line joins and line caps can change the appearance of the ends and corners of paths, but maybe not as much as you want. They can’t draw line-cap shapes other than circles or squares, and they can’t draw anything wider than the stroke itself. That means they can’t draw an arrowhead.
Arrowheads are the quintessential use of the <marker> element, but there are many other possibilities. Markers can be used to create custom line-join shapes, or to draw symbols on all the points in a line chart.
Markers offer a number of conveniences, compared to line joins, or compared to drawing each marker symbol individually as a <use> copy of a <symbol>. However, as defined in SVG 1.1, markers are still rather limited. Many things that you might expect to be able to do aren’t supported. There are also a number of bugs and inconsistencies that limit the use of markers to the simpler cases.
A few additional marker options are included in SVG 2, but many other advanced features were deferred to a separate SVG Markers module. At the time of writing, it’s not clear when further work might happen on those proposals.
Figures and Examples#
The file names link to the code view on GitHub. Beware: the linked screenshots are hi-resolution; some have very large file sizes.
View all files for this chapter on GitHub.
 Figure 14-1. A path with a marker on it
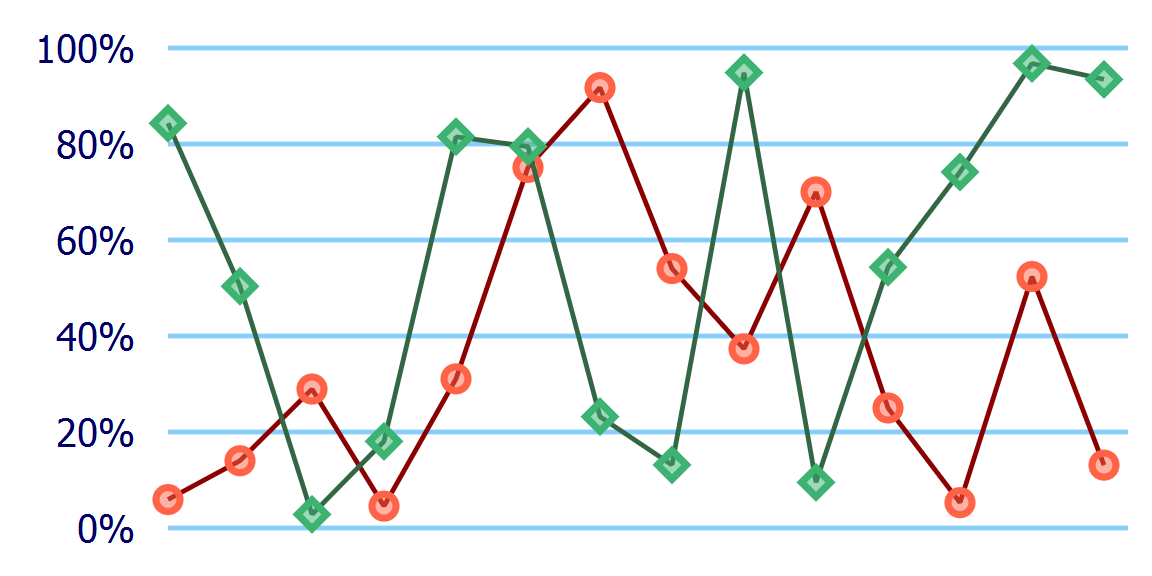
 Figure 14-2. A line chart with markers at every data point
- Example 14-1. Using markers to annotate a line chart
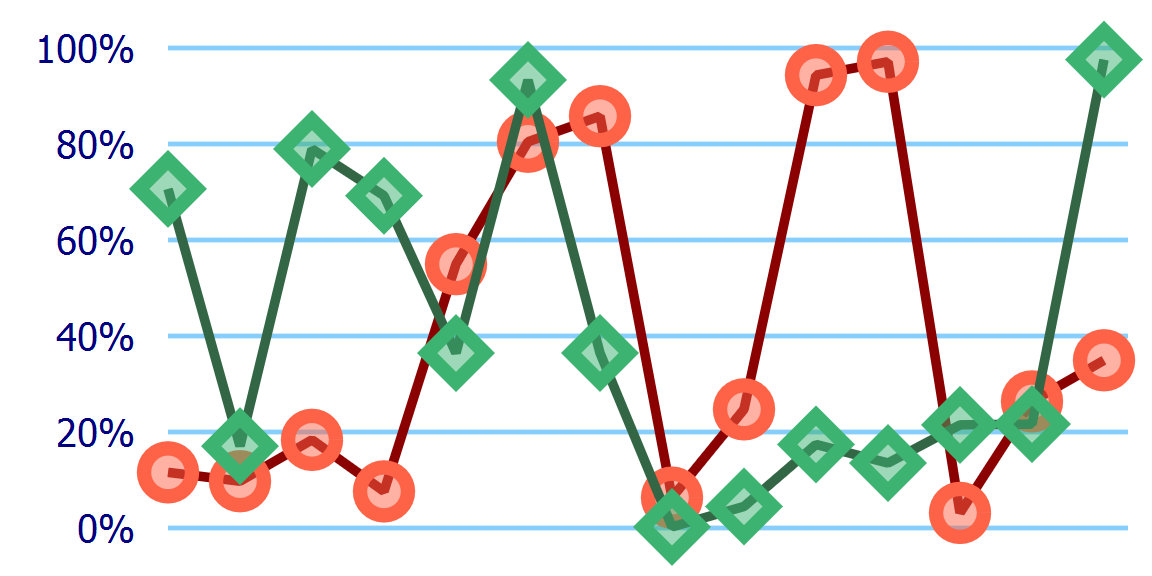
 Figure 14-3. A line chart with markers, where the lines are drawn twice as thick
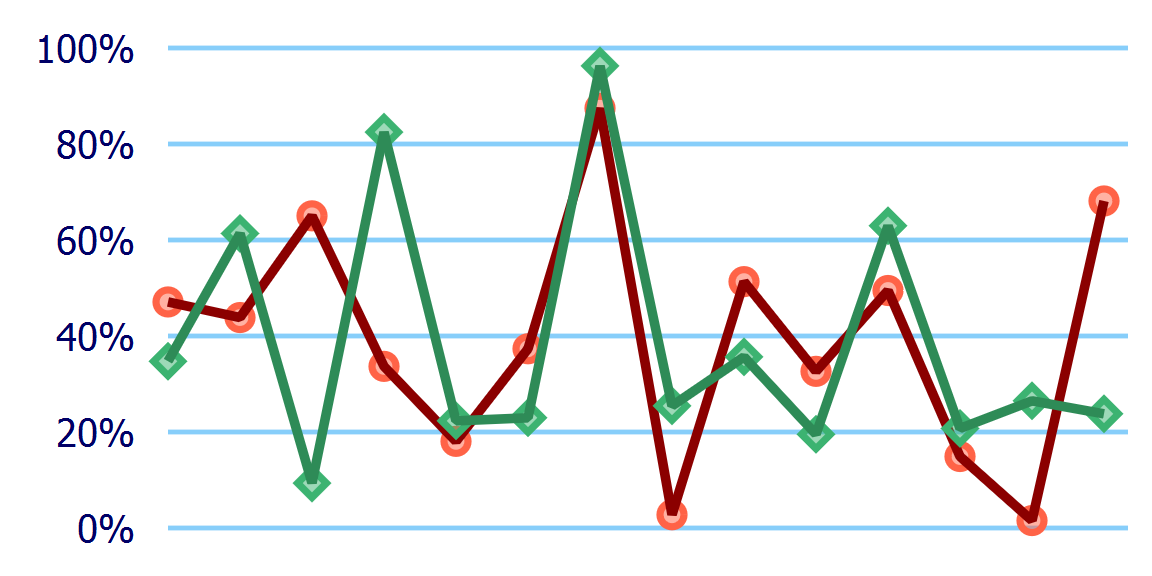
 Figure 14-4. A line chart with markers, where the lines are drawn twice as thick, but the markers have a fixed size
 Figure 14-5. A line chart with markers drawn under the line
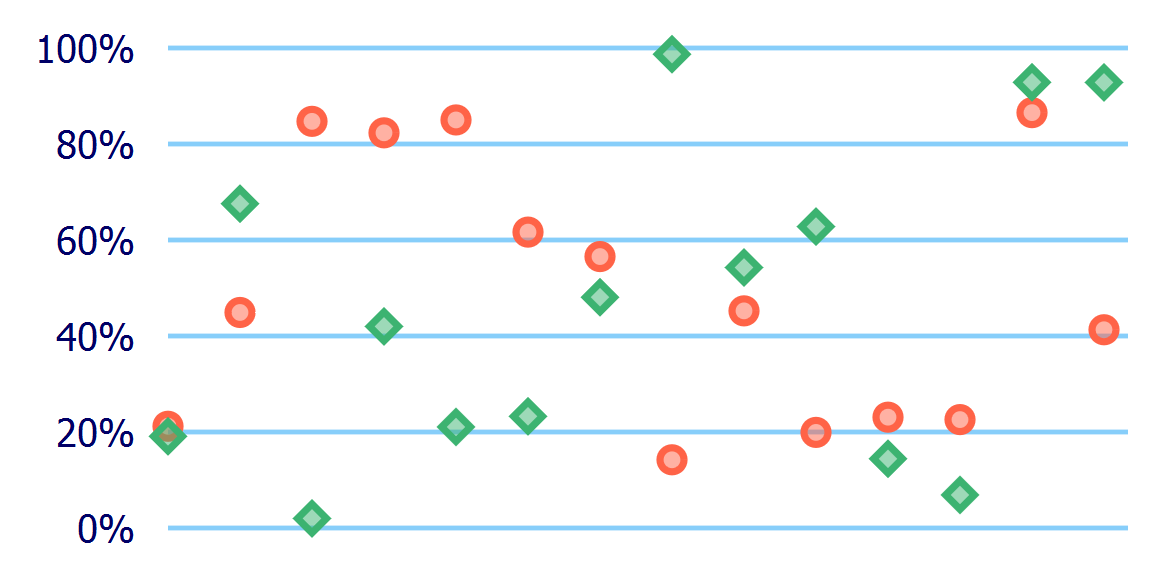
 Figure 14-6. A scatterplot chart drawn as markers on unstroked polylines
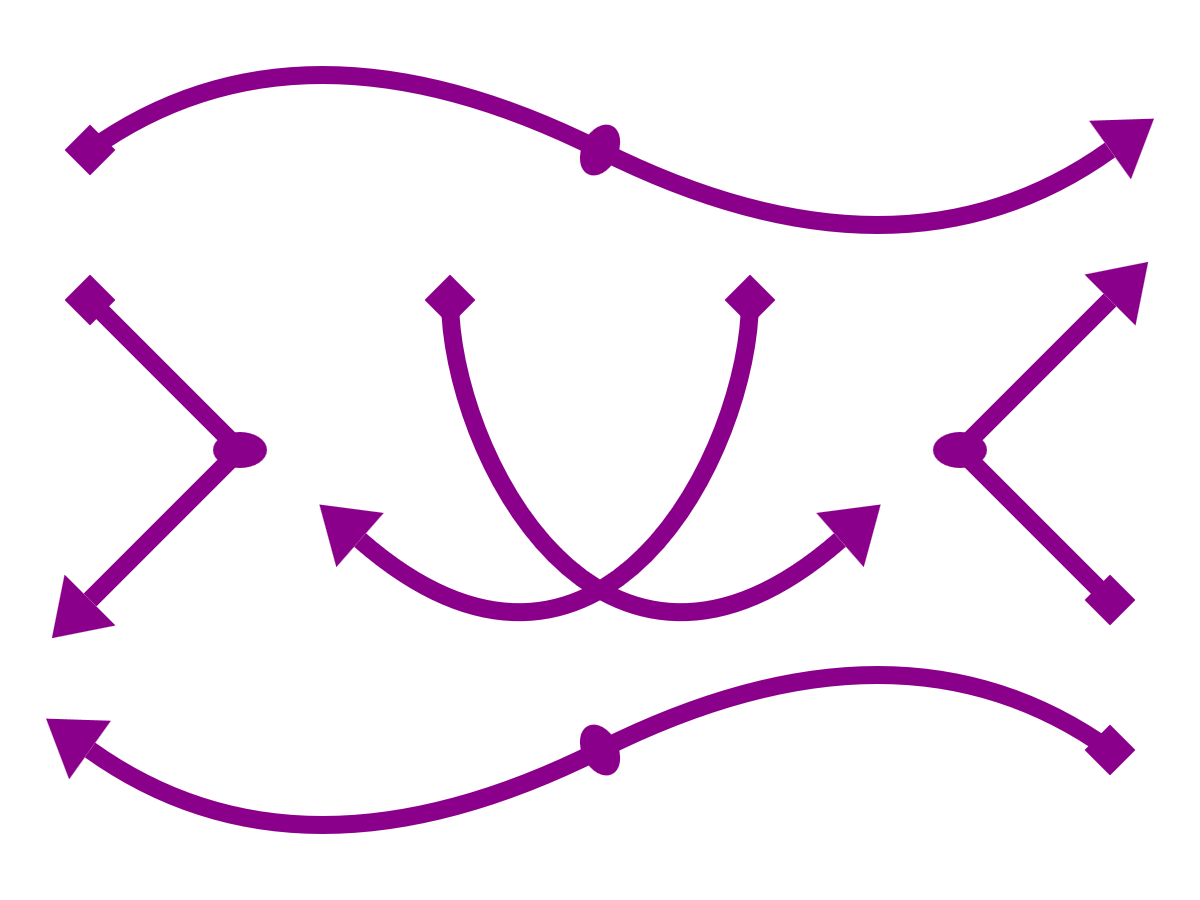
 Figure 14-7. Arrows created with line markers on paths
- Example 14-2. Drawing arrowheads that rotate with a line—and starting markers that don’t—with the orient attribute
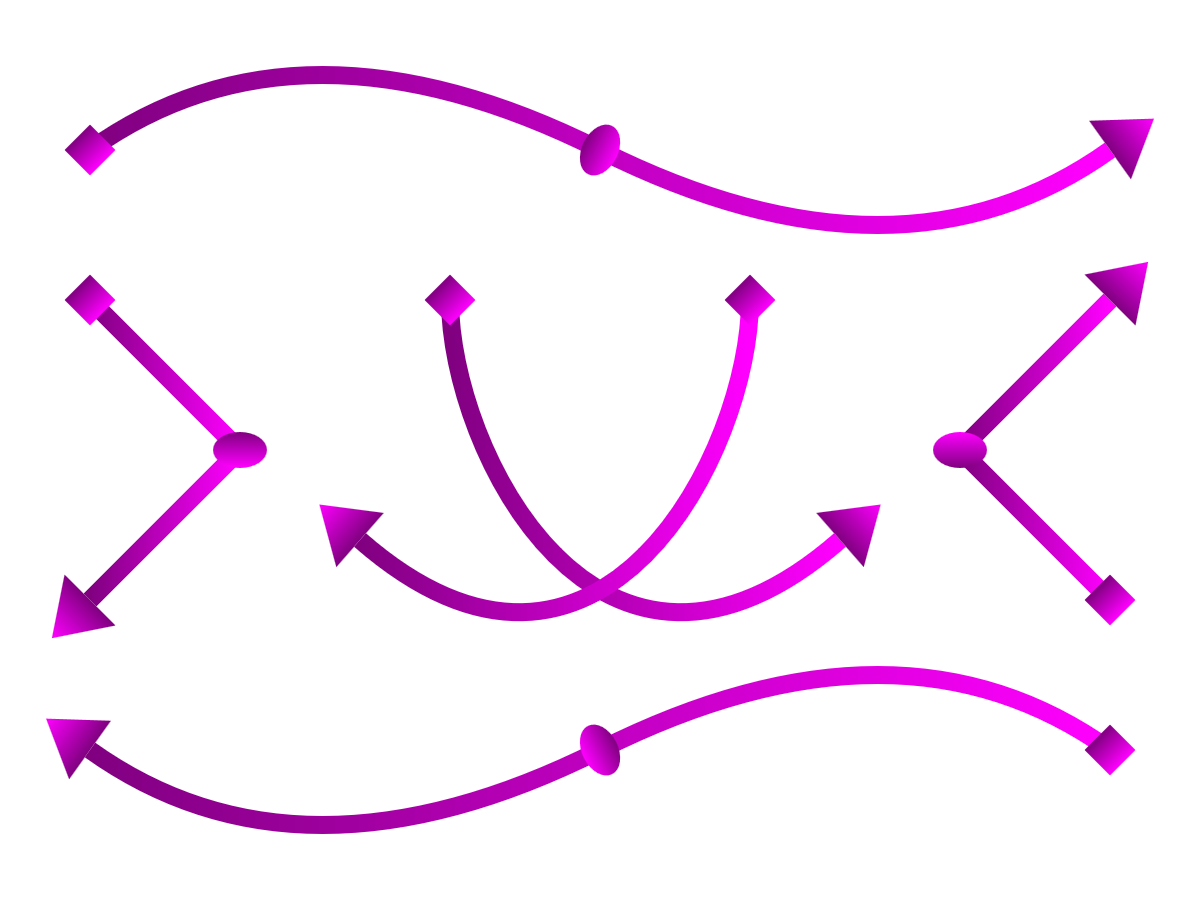
 Figure 14-8. Line-marker arrows, where the line and the markers are painted with the same gradient
- Example 14-3. Positioning and scaling a marker, without needing visible overflow
 Figure 14-X1. A heart-marked valentine heart
- Example 14-X1. Using icons as markers
 Figure 14-X2. A heart-marked valentine heart, in MS Edge, after adjusting the code to satisfy Microsoft browsers
Online Extras#
- “Re-purposing Icons as Markers”: Turning an existing symbol into a marker is a matter of copy and paste, plus a few attributes. Just watch out for the browser quirks.
- Reference: SVG Elements and Attributes