Calculating Cubic Béziers
In Chapter 6 in the book, we showed how a quadratic Bézier curve is constructed mathematically from the end points and the control point, by comparing it to a “string art” drawing, as shown in Figure 6-X4.

Cubic Bézier curves are more complicated, starting from the fact that they have two control points for each segment. If you wanted to draw a cubic curve by hand, using the “string art” method, you would need a multi-step process:
-
First, you create two over-lapping quadratic curves as a sort of scaffolding:
-
using the cubic curve’s start point, first control point, and second control point
-
using the two control points and the end point.
-
-
Then, you create a new set of strings that start and end at evenly-spaced positions along these curves. For example, one line would start at 10% of the distance along the first quadratic and end 10% of the distance along the second quadratic.
-
This second set of strings are the tangents to your cubic curve. The point 10% of the distance along your 10% line would be a point on the curve.
The string art diagrams get rather messy for cubic curves, as shown in Figure 6-X5, but the final curves can be very elegant. The dark blue and purple lines show how the quadratic scaffolding was constructed. The thick red strings connect them and sketch out the actual cubic Bézier shape.
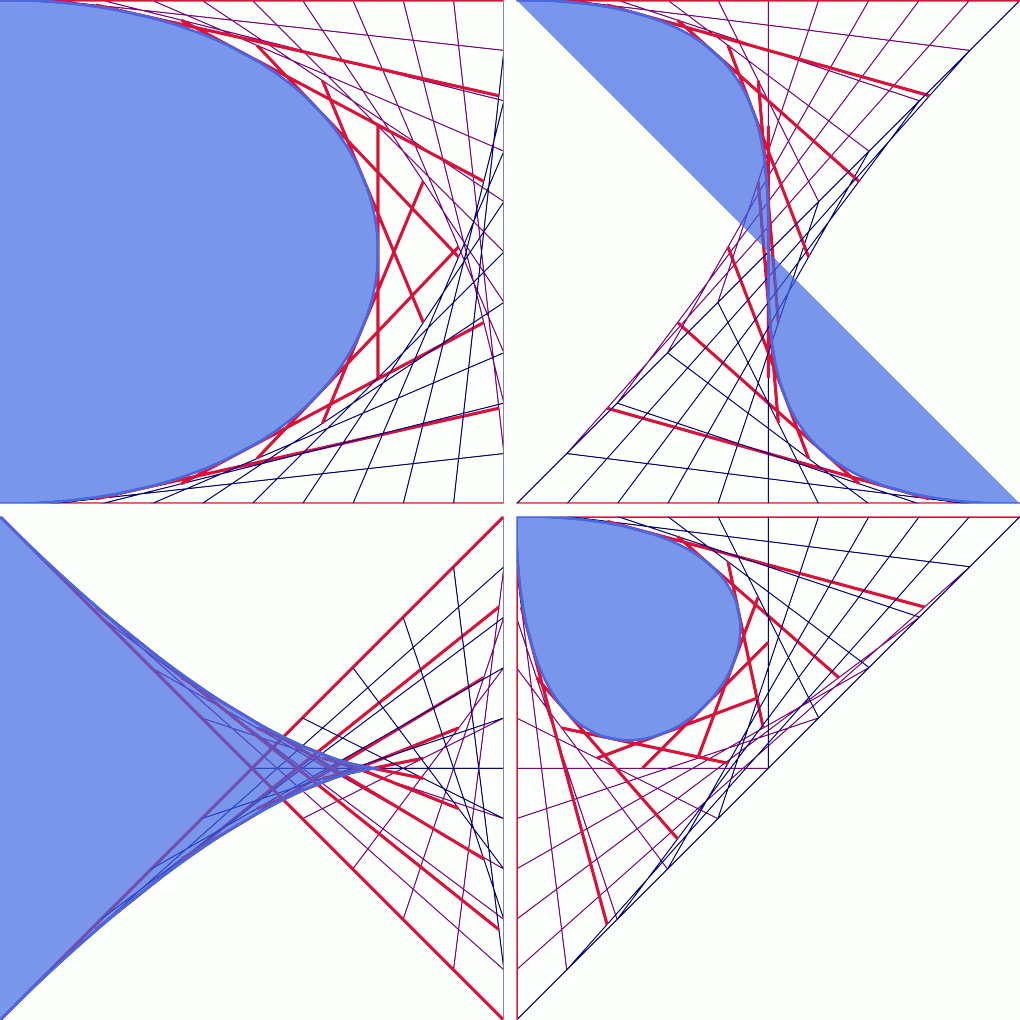
The four curves in Figure 6-X5 are as follows (using a scale with 10 units along each edge of the square, instead of 10cm):
<pathd="M 0,0 C 10,0 10,10 0,10"/><pathd="M 0,0 C 10,0 0,10 10,10"/><pathd="M 0,0 C 10,10 10,0 0,10"/><pathd="M 0,0 C 0,10 10,0 0, 0"/>
Each curve has start, end, and control points in different corners of a square; the thin purple and navy strings are used to sketch out the quadratic curves, and then the thick red strings sketch the cubic curve. Nonetheless, for the computer, it is just a weighted average of weighted averages of all the points.
View a live, animated version of the S-curve. You can then change the start point, control points, and end point by editing the s, c1, c2, and e parameters in the URL.